Pralana Gold provides unprecedented user control over the content and presentation of its tabular output data. As a user of a true high-fidelity retirement calculator, you deserve nothing less!

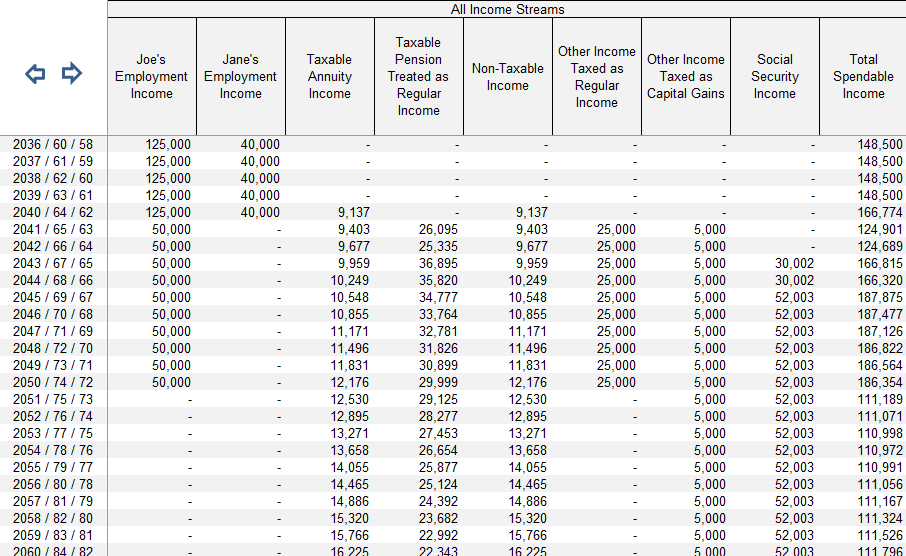
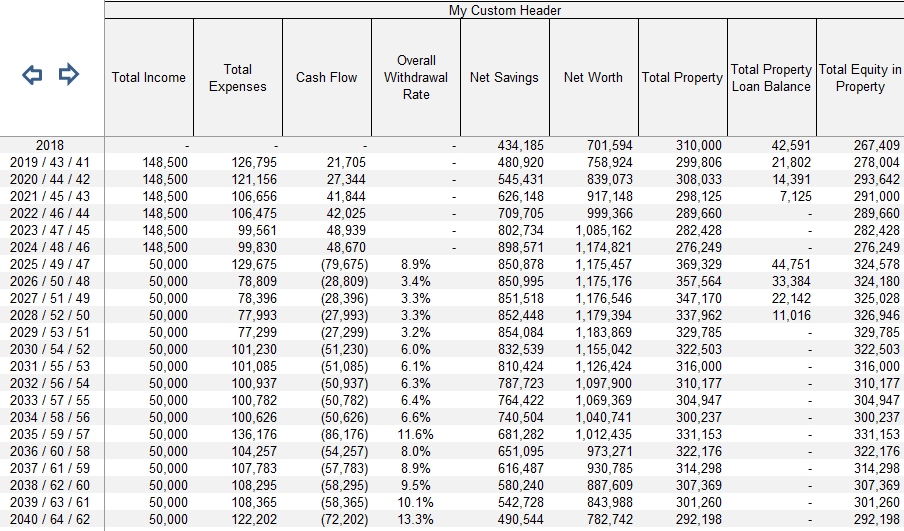
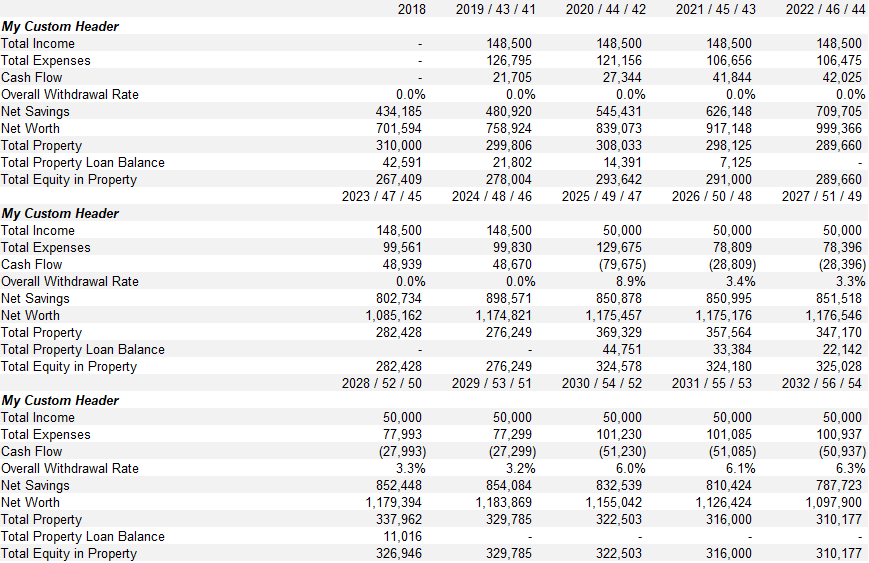
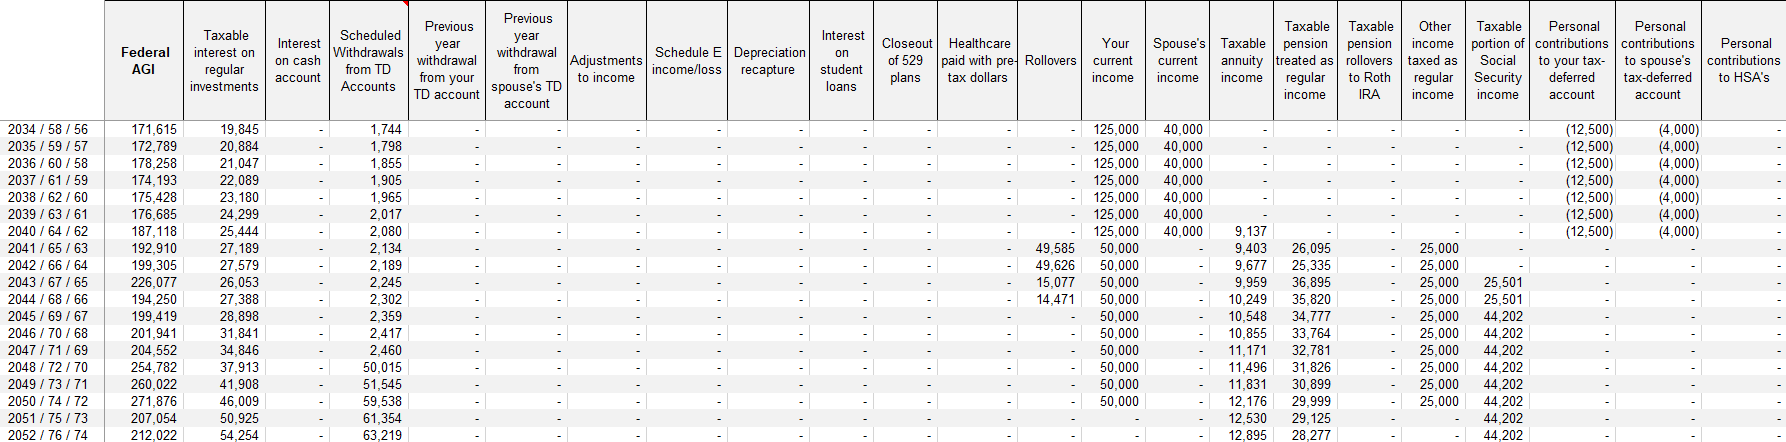
There are 132 calculated data elements available for each year in its projections but you are not forced to look at and sift through all of them to examine your plan outputs. Instead, you can define up to eight views into this massive set of data, and each view can contain from one to 30 of these data elements ordered in any way you desire. Further, you can define headers that span one or more data elements. Further yet, you can control whether the projections are presented with years in rows and data in columns or with years in columns and data in rows. None of these views is a “canned” view; all of them are under your control. PRC contains three default views to get you started but you can change them in any way you choose. Here’s a screenshot of the navigation bar showing the primary nav buttons at the top and the nav buttons to the user-specified views at the bottom.

Pralana Gold’s customization feature enables you to define views that contain only the data pertinent to YOU and ordered the way YOU want it. No more columns containing only zeroes or in the wrong order!